Regression and probability analysis of Instacart grocery reorder data
A DAT301 data analytics project analyzing the Instacart Market Basket dataset in a single Jupyter notebook. It explores how order quantity, purchase frequency, and days between orders relate to product reorders using data merging, visualization, OLS regression, and a binomial probability model. The work covers data cleaning, exploratory plots, regression diagnostics, and a probability mass function for cart checkout behavior. **Highlight:** R-squared = 0.742 for reorders-vs-products regression
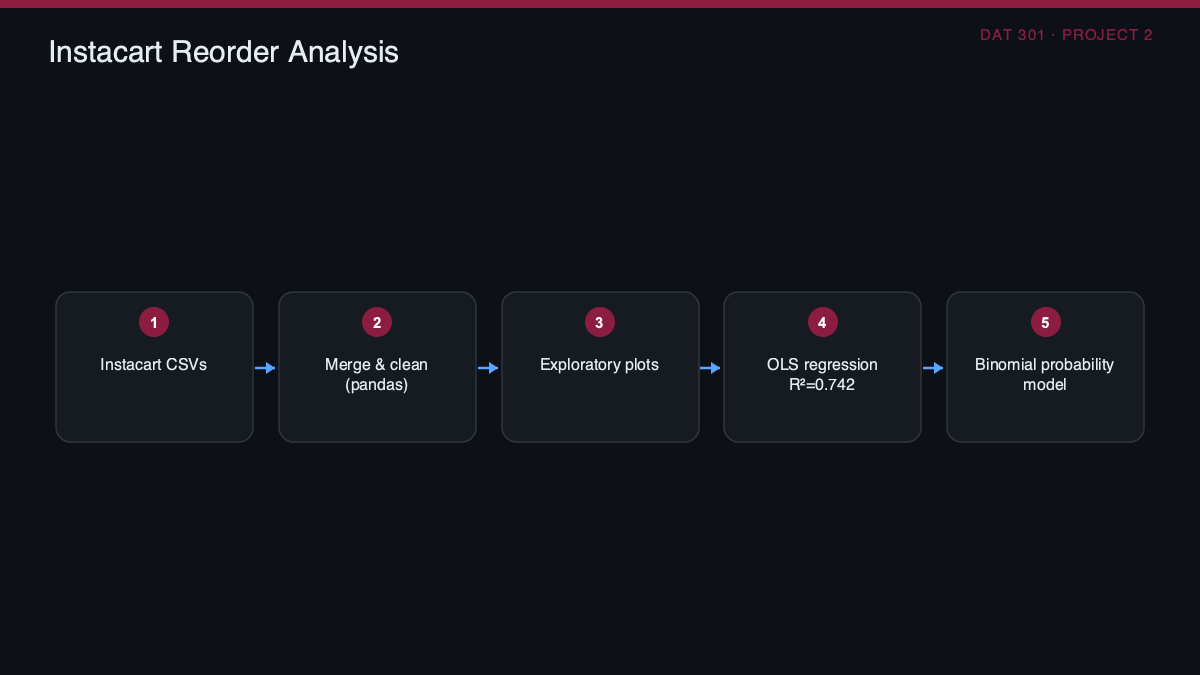
Working in Python (pandas, numpy, seaborn/matplotlib), the notebook reads and merges the Instacart file collection, then cleans and visualizes the data to expose relationships between reorders, products per order, and time between orders. It applies OLS regression via statsmodels for both a three-variable and a two-variable model, evaluates fit with residual, QQ, and fitted-line plots, and closes with a hand-derived binomial distribution implemented with scipy to model checkout cart behavior.
The two-variable regression of products on reorders reached an R-squared of 0.742, indicating a strong linear relationship, while the three-variable model showed weak correlation; distributions were found to be right-skewed and the binomial model gave a mean of 3.25 items per 5-item cart.