Exploratory data analysis and visualization of Instacart grocery data in R
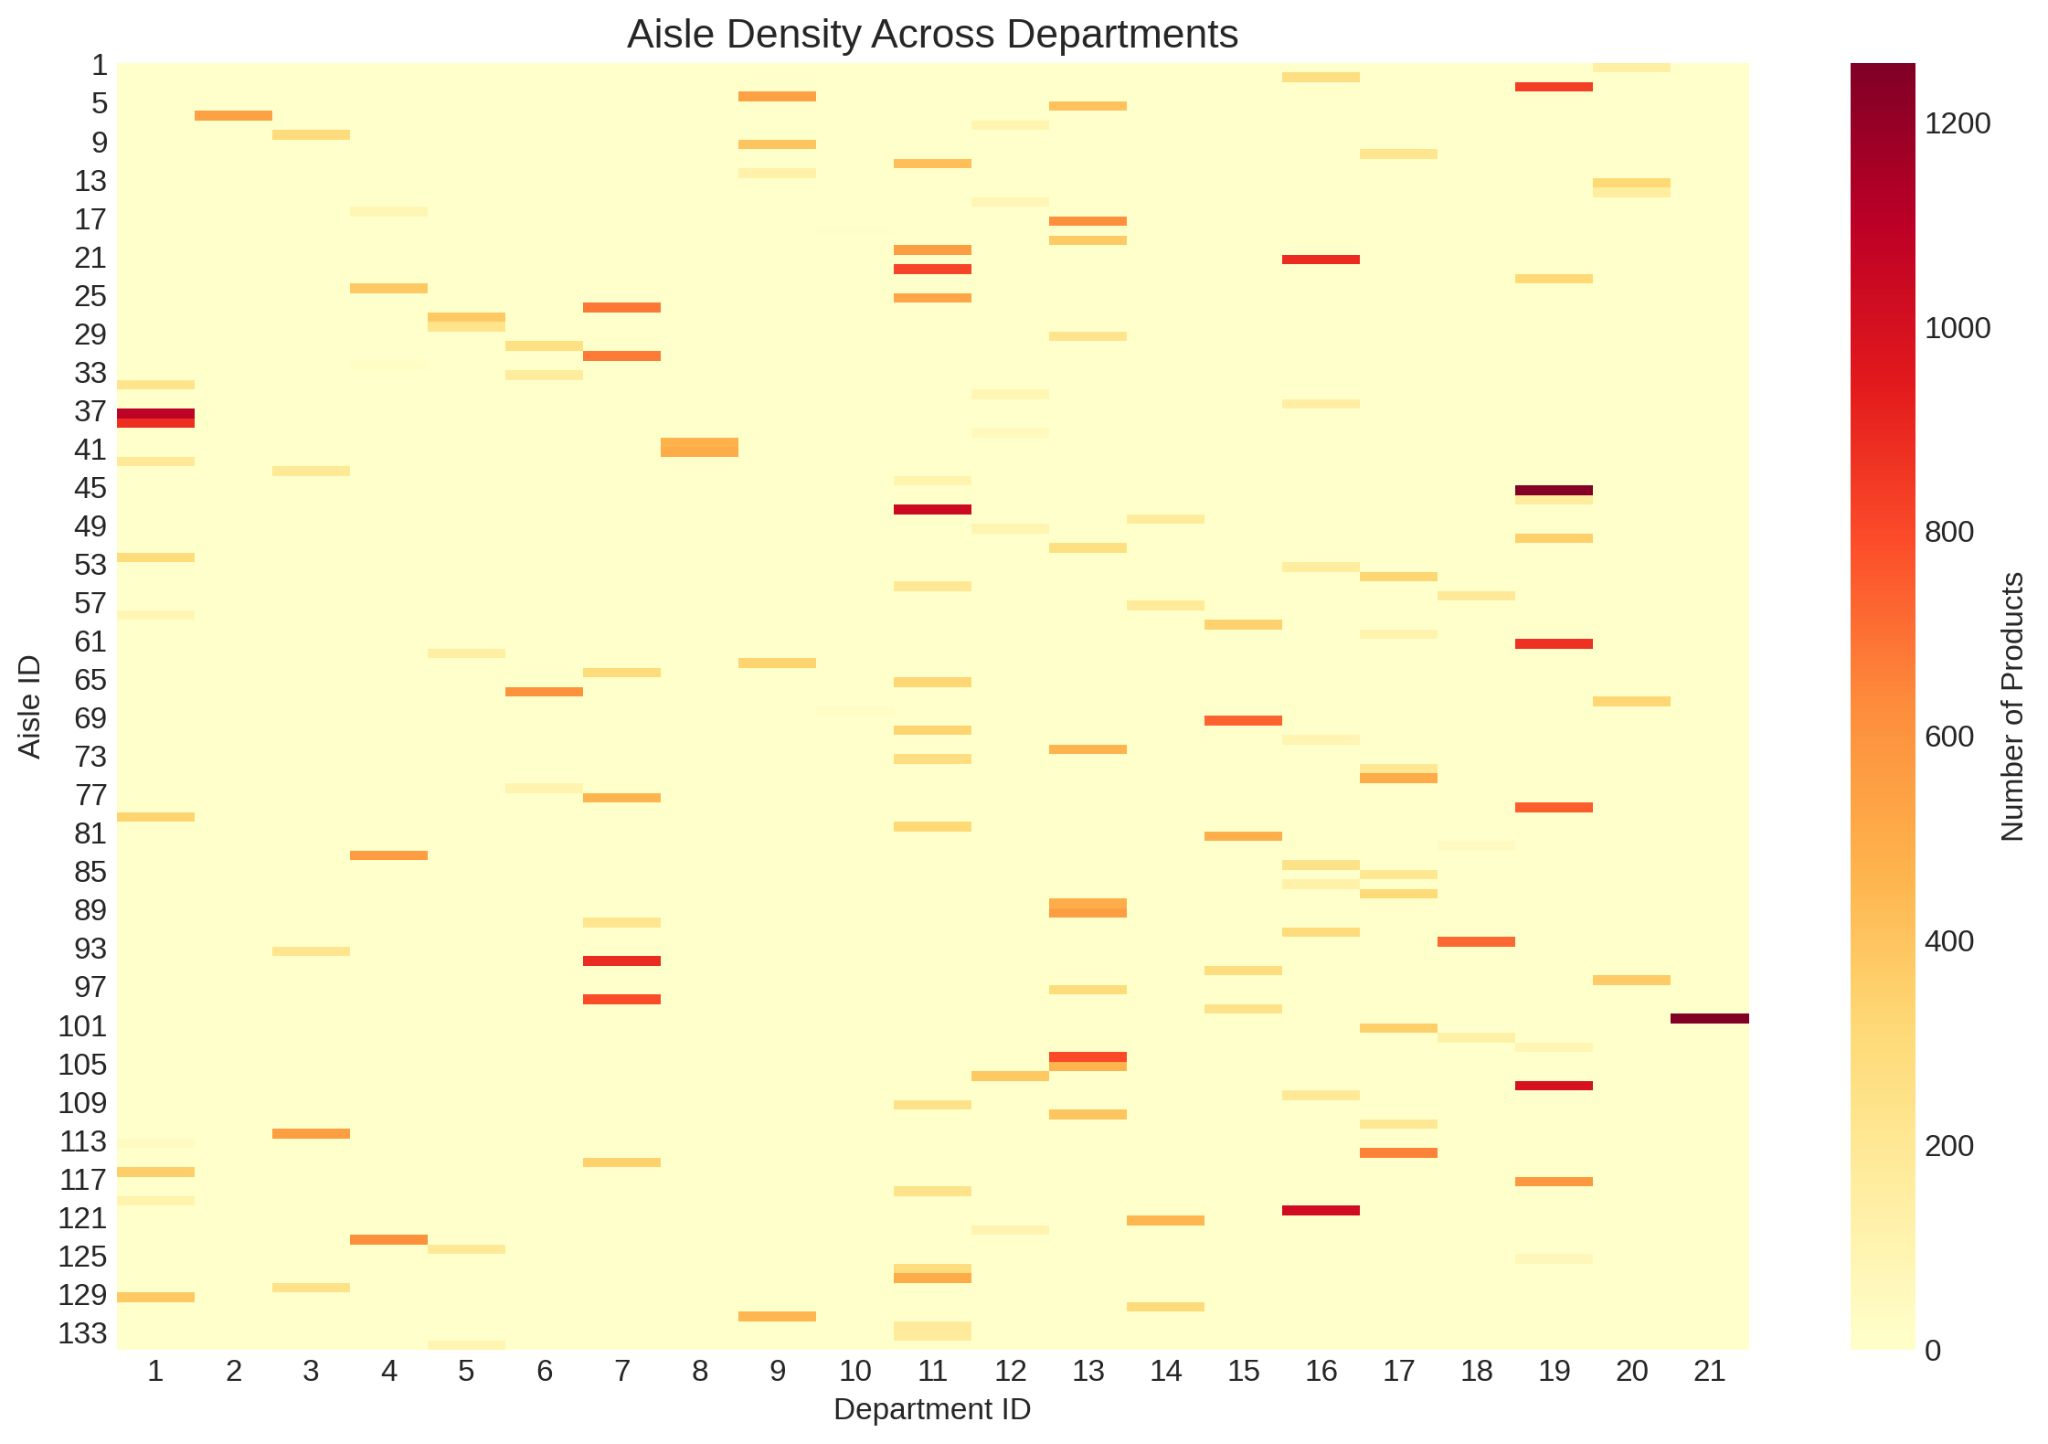
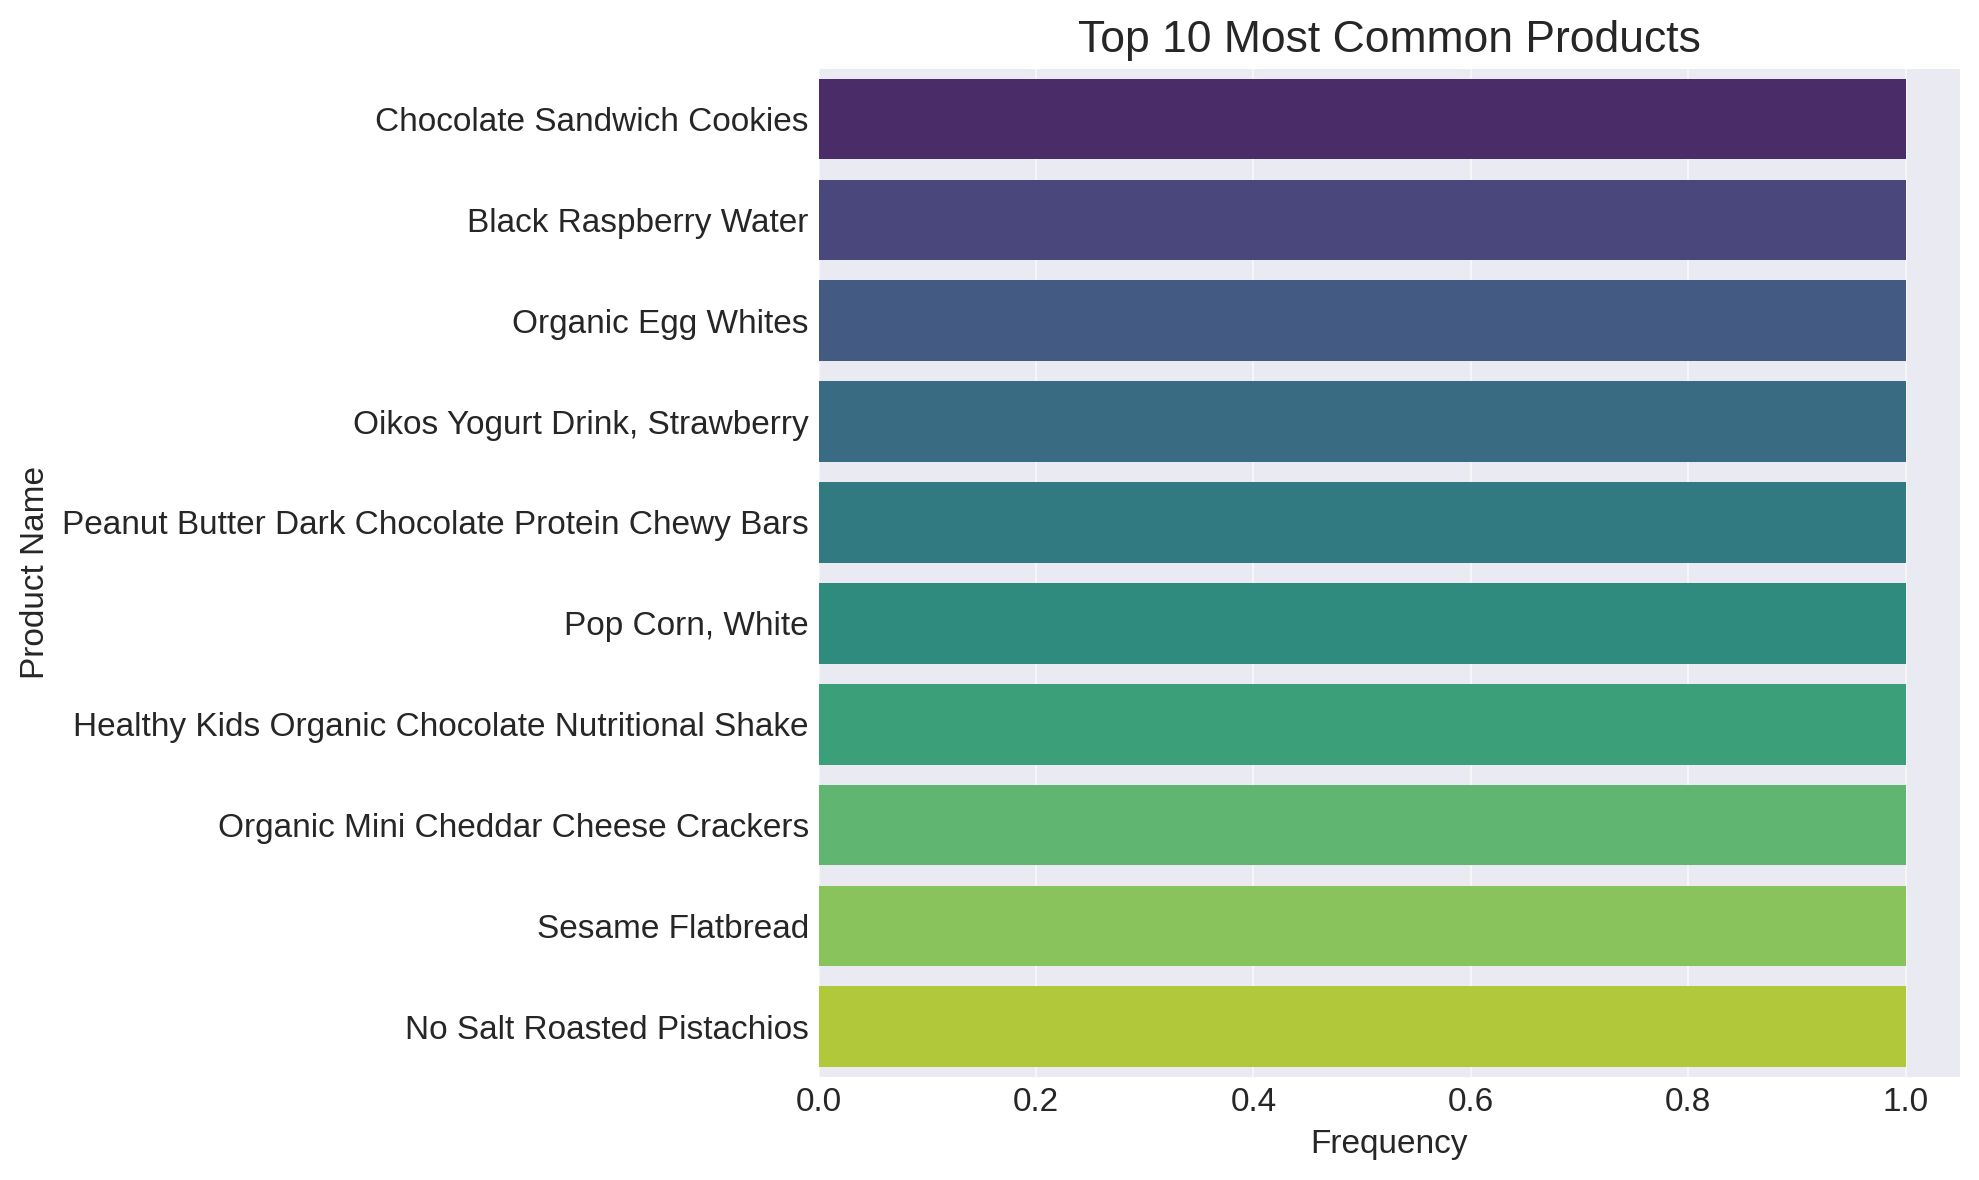
Coursework for BIO 479/579 (Data Analysis & Visualization in R, Fall 2024) exploring Instacart's online-grocery datasets with the tidyverse. One deliverable analyzes the products catalog (department counts, aisle density, top items, wide-to-long reshaping) and presents it as a slide deck; another is an R Markdown report profiling the orders dataset with summary statistics, tidyverse manipulations, and three ggplot2 visualizations. A separate assignment critiques effective versus ineffective data graphics. **Highlight:** 3,421,083 orders profiled (7 columns)
Datasets are loaded with readr, then inspected for structure and format (str/glimpse) before analysis. Aggregation and filtering use dplyr group-by/summarise pipelines and tidyr/reshape2 for reshaping between wide and long formats. Each visualization uses a distinct ggplot2 geom (bar, tile/heatmap, scatter, density) with theme_minimal styling, and findings are written up alongside the code in R Markdown and presentation form.
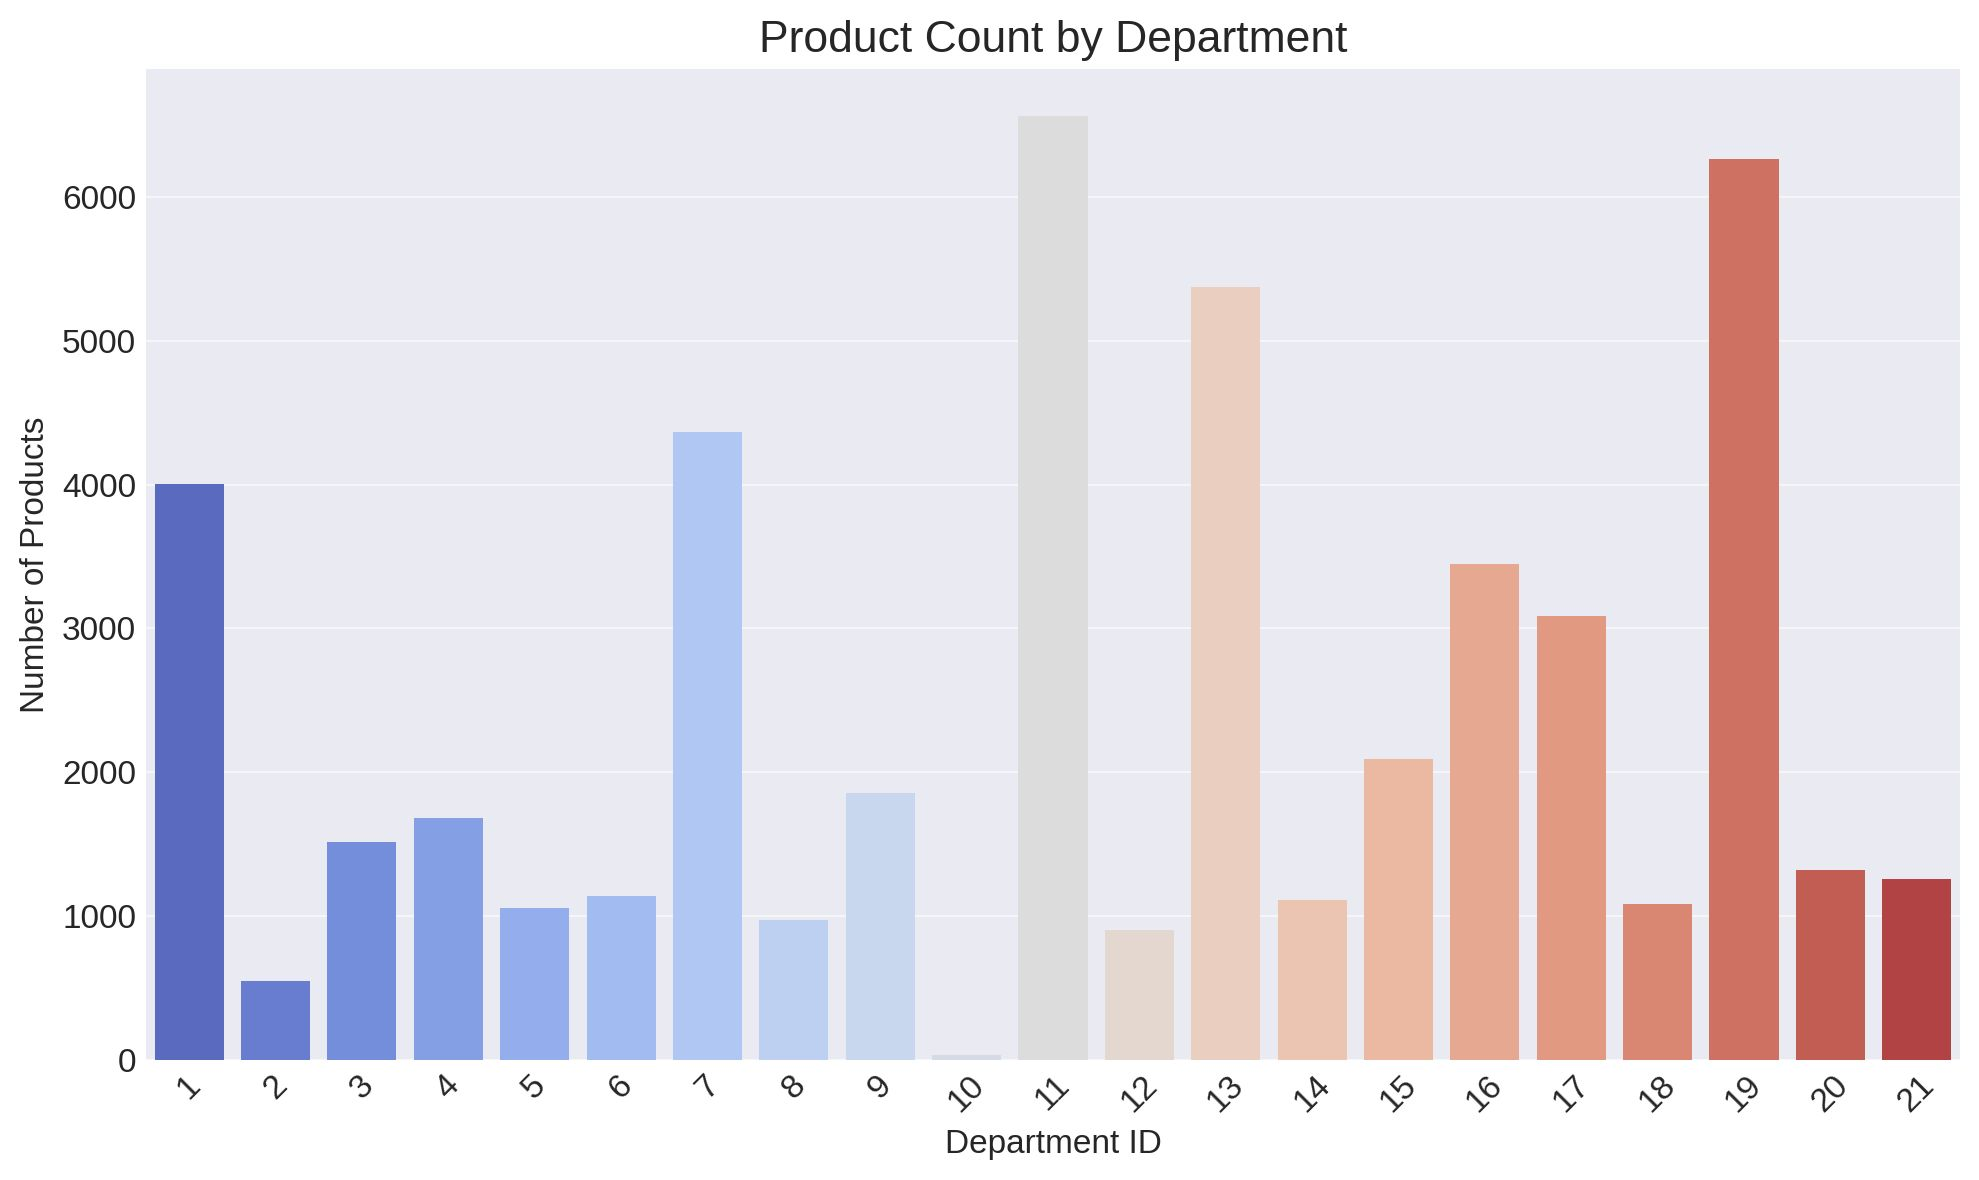

The orders dataset is profiled as 3,421,083 rows across 7 columns; the products analysis reports departments 13 and 19 as the largest by product count and aisles 33 and 41 as the most diverse. See docs/BIO579_Presentation-1.pdf and docs/MidCourseSummaryAssignmentElsaady.html for the full deliverables.